|
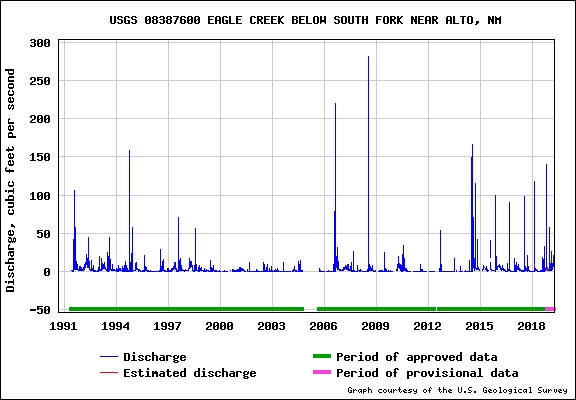
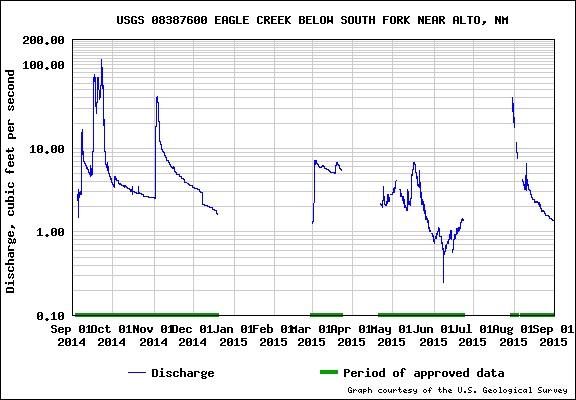
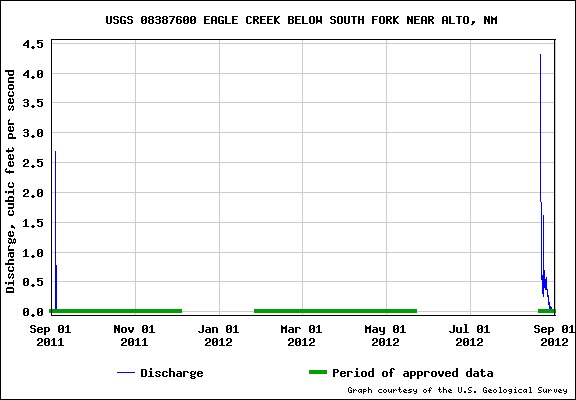
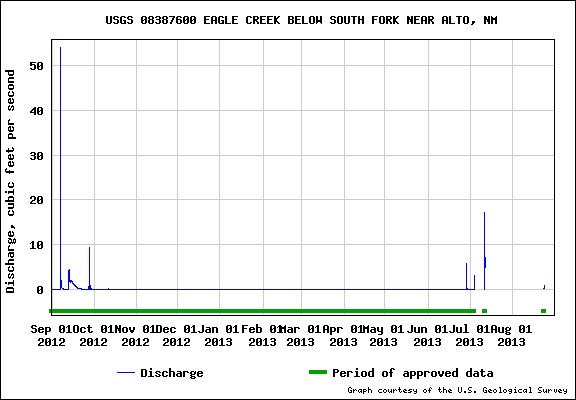
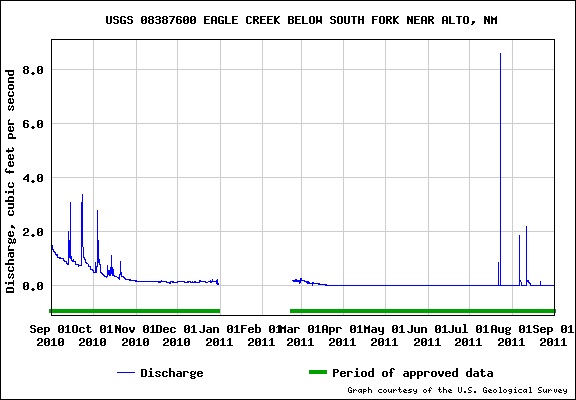
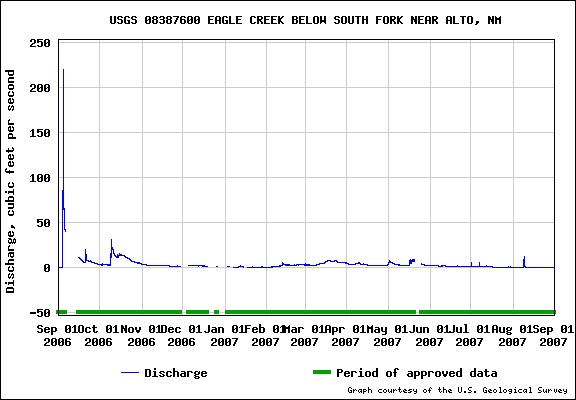
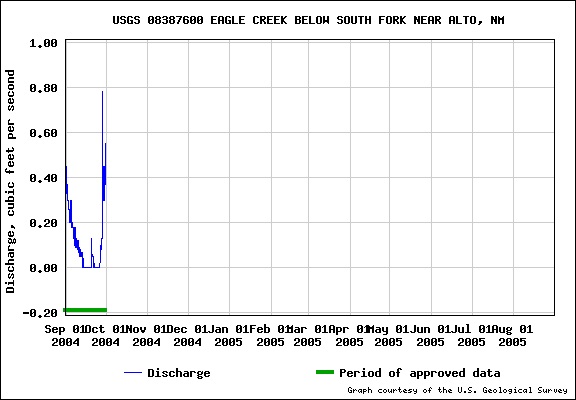
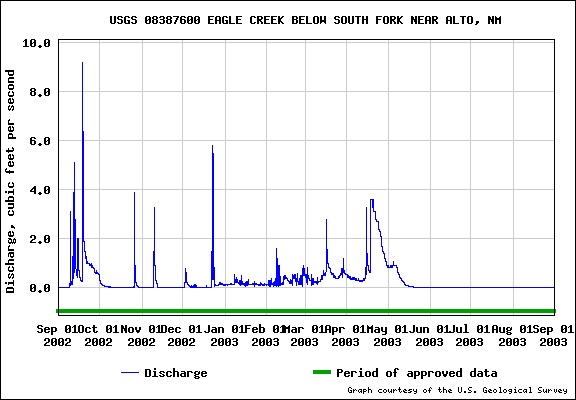
The previous web pages discussing the hydrology of Snowy River have focused on the cave, and the understanding of where the water comes from. Since the discovery of Snowy River in 2001 we have come to realize that at least most of the water originates from the rain and snowfall on Sierra Blanca. As we have explored and surveyed the cave, the passages do, indeed, continue to support this understanding. Four days after the unexpected 2008 Hurricane Dolly flood, which was mostly in Ruidoso, Government Spring was found to be flowing, and on inspection at Turtle Junction we found that Snowy River was also flowing enough to perform a water trace with the spring. Several home-made water loggers were thrown together and a Schlumberger Baro and Water Logger unit was purchased and placed at Turtle Junction. Then in 2010, following heavy rains, we again experienced a Snowy River flow at Turtle Junction that lasted for several months. Analysis of this Snowy River Water Flow first identified a time relationship between the rains measured at the Ruidoso Airport KSRR weather station and the arrival time of the water at Turtle Junction. It appeared that the 72-80 hour time lag between local rains and the flow at Turtle Junction was strongly related. But comparing the flow rate to a single weather station was much too simple for a hydrology system that likely covered a greatly expanded area. In 2012 we were able develop a plan for a more extensive measurement area in the cave, and in 2013 around a dozen professional data loggers were deployed. A 4-year flow started in 2014 and it would be a few years later before we obtained additional information. Additional loggers were added to the Fort Stanton Cave array, and the new loggers extended into the Main Corridor. Some loggers are deep enough in the cave that they have not yet been recovered since the 2013 deployment. As we continue to gather additional data from the cave and correlate it with USGS data from the 8387600 Eagle Creek gauging station, it is now of interest to look at the overall water flows monitored by this USGS station since 1991, a decade before the discovery of Snowy River. Steve Peerman has taken the lead in analyzing the relationship between the USGS Eagle Creek station and is also seeing a similar relationship ("most of the time"), but the hydrology is not a simple problem. Analysis continues. The following charts for the #8387600 Eagle Creek gauging station will give an idea of the "wet years". The vertical scales are adjusted to show the peak flows during the time graphed, so look carefully at the scale on the left side of the graph and understand that Snowy River appears to flow only after a certain volume of water enters the aquifer. Currently we believe that flows at this USGS station exceeding 8-10 cfs (cubic feet per second) are the most likely to fill the aquifer to the point where Snowy River actually flows. Other work continues that correlates the time deposition of the Snowy River calcite, some of which is mentioned in the bibliography. |
28 Year Record of Eagle Creek Water Flows |
||
 |
||
 |
2017-2019 |
 |
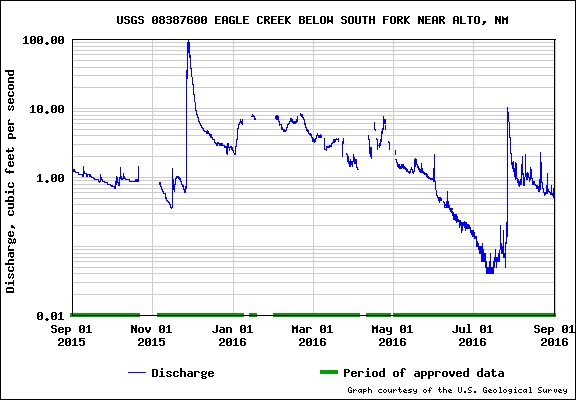 |
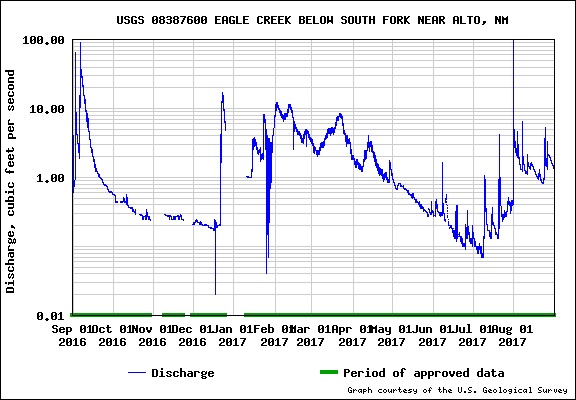
2015-2017
|
 |
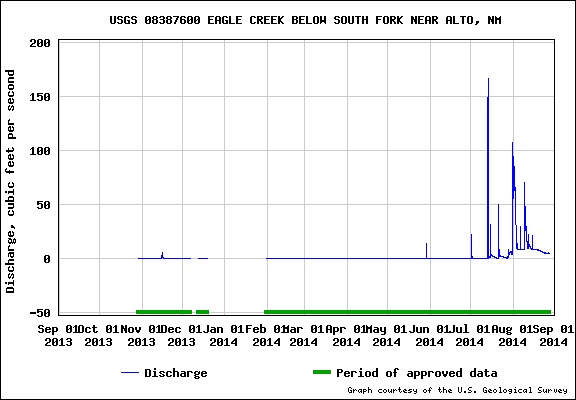 |
2013-2015
|
 |
 |
2011-2013
|
 |
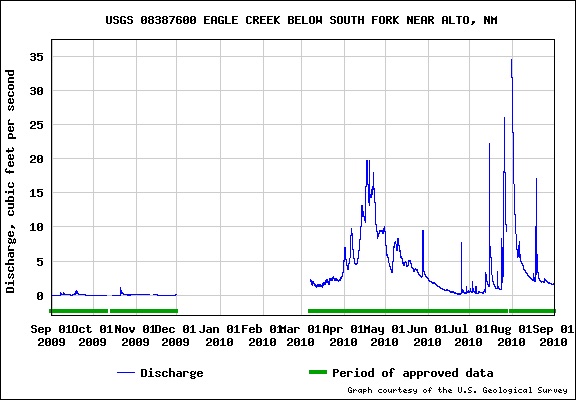 |
2009-2011
|
 |
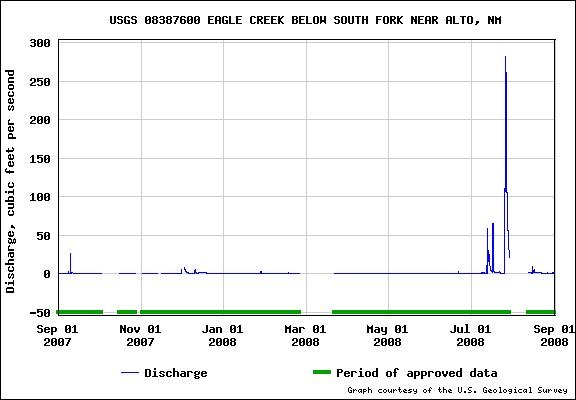 |
2007-2009
|
 |
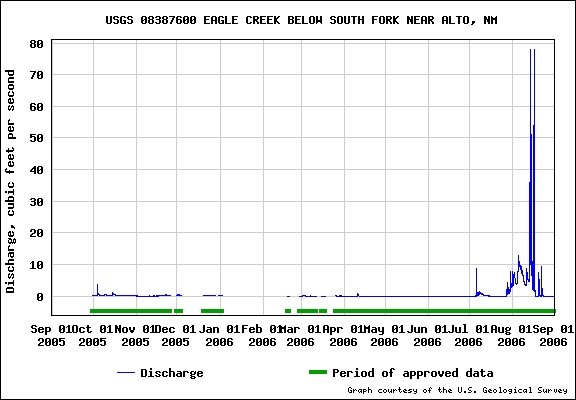 |
2005-2007
|
 |
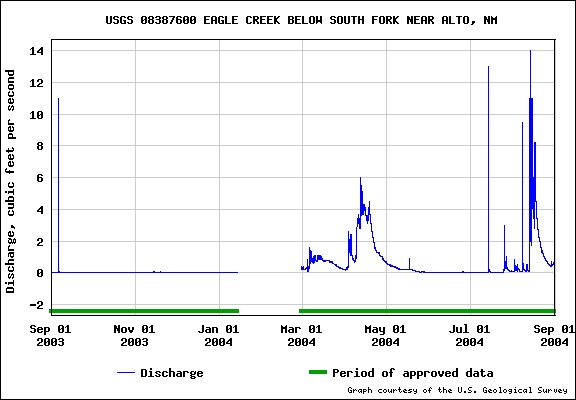 |
2003-2005 |
 |
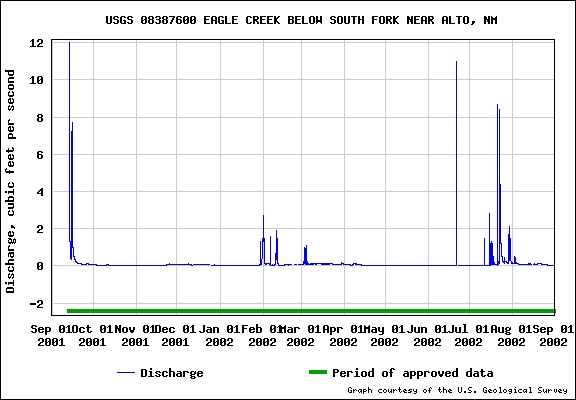 |
2001-2003 |
 |
 |
1999-2001 |
 |
 |
1997-1999 | 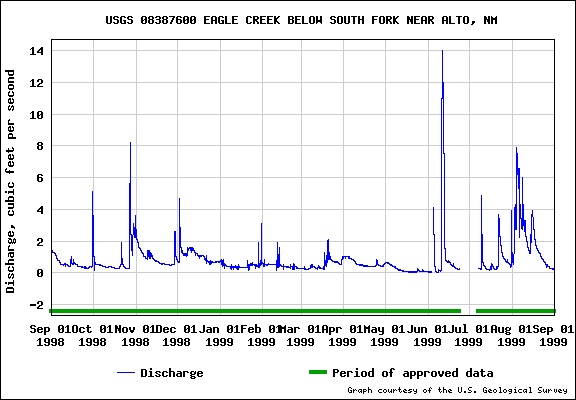 |
 |
1995-1997 | 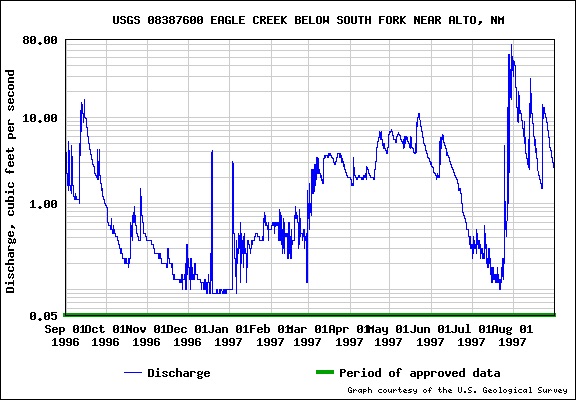 |
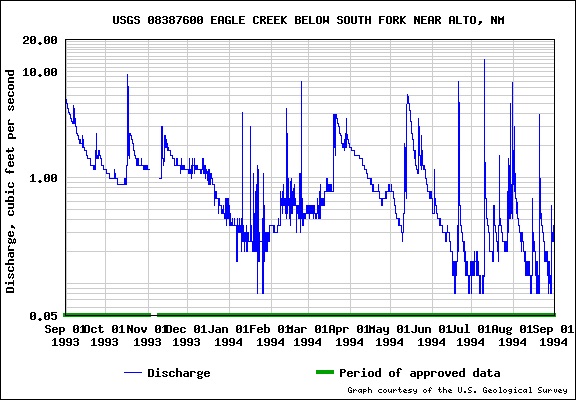 |
1993-1995 |  |
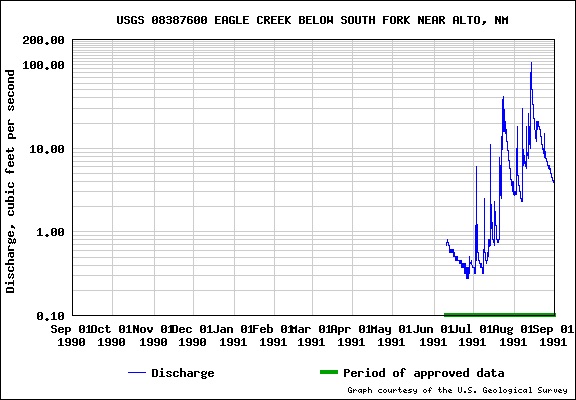 |
1991-1993 | 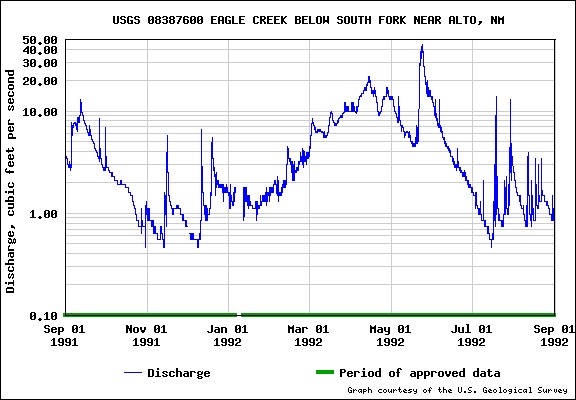 |
Rev. 4-24-2019 |
Comments to the webmaster |
Contact the FSCSP President |
Contact the Project Director |